
Chapter 10. Fault Tree Analysis and Event Tree Analysis
10.1. Fault Tree Analysis and Event Tree Analysis
10.2. Fault Tree Analysis FTA
10.3. Fault Tree Analysis (FTA) Symbols
10.4. Event Tree Analysis (ETA)
10.5. “And / Or” Logic
10.6. Fire Triangle
10.7. “And / Or” Logic
10.8. Success Versus Failure Logic
10.9. Success Versus Failure Logic(contd.)
10.10. Success Versus Failure Logic(contd.)
10.11. Fault Tree
10.12. Symbols Used in FTA
10.13. Electrical Circuit
10.14. Fault Tree
10.15. Guidelines for Fault Tree Construction
10.16. Guidelines for Fault Tree Construction Fault
10.17. Guidelines for Fault Tree Construction
10.18. Guidelines for Fault Tree Construction (contd.)
10.19. Guidelines for Fault Tree Construction(contd.)
10.20. Guidelines for Fault Tree Construction(contd.)
10.21. Guidelines for Fault Tree Construction(contd.)
10.22. More Guidelines
10.23. More Guidelines(contd.)
10.24. Boolean Algebra
10.25. Boolean Algebra Representation of a Fault Tree
10.26. Boolean Review
10.27. Boolean Review(contd.)
10.28. Fault Tree Reduction and Equivalence
10.29. Fault Tree Equivalence
10.30. Common Cause Failures
10.31. Common Cause Failures
10.32. Steps to Identify Common Cause Failures
10.33. Fault Tree Analysis for a Reactor
10.34. Fault Tree Analysis for a Reactor(contd.)
10.35. Fault Tree Analysis for a Reactor(contd.)
10.36. Fault Tree for Rupture of Reactor
10.37. Event Trees
10.38. Typical Event Tree
10.39. Multiple System Modeling
10.40. Linked Fault and Success Trees
10.41. Quantitative Analysis
10.42. Quantitative Analysis(contd.)
10.43. Available Computer Programs
10.44. Fault and Event Tree Analysis Applications
10.45. Fault and Event Tree Analysis Applications(contd.)
10.46. Fault Tree Analysis is Not Applicable…
10.47. Evaluation of the probability of the top event occurring for a fault tree
10.48. Evaluating Overall Event Probability for Fault Tree Analysis
10.49. Evaluation of the probability of the top event occurring for a fault tree
10.1. Fault Tree Analysis and Event Tree Analysis
Determines how an undesired event occurs.
Uses results from hazard identification analyses.
Determines how often an event can occur.
Fault Tree Analysis (FTA) and Event Tree Analysis (ETA) are logical modeling tools that are used to determine how an undesirable event can happen. HAZOP and other hazard identification techniques analysis help determine what undesirable events can occur. Also, these methods can be used to determine how often an event can occur when they are used with component failure rate data and human reliability data.
10.2. Fault Tree Analysis FTA
Uses graphical diagrams to show logic behind the deductive reasoning
Can be used on multiple systems as well as single systems
Treats the issue of common cause failures
Can produce quantitative and qualitative results
Fault tree analysis, or FTA, is a deductive reasoning tool and it uses a graphical diagram to show the logic of deductive reasoning about how an undesired event can occur. We provide a basic introduction to this method, and the discussion of probability theory and mathematics of logic are given in texts devoted to this subject, for example, the one by Louvar and Louvar shown here.
J. F. Louvar and B. D. Louvar, Health and Environmental Risk Analysis, Prentice Hall, Upper Saddle River, NJ (1998)
10.3. Fault Tree Analysis (FTA) Symbols
Fault tree diagrams are constructed using the symbols shown in this slide and other similar ones. These symbols are grouped in three categories, events, logic gates and transfer symbols.
Top and intermediate events are shown as rectangles with a description inside the symbol. Primary or basic events are initial faults and are shown as circles or rectangles with small circles attached.
Logic gates are symbols used to represent “and” and “or” logic operators. These logic gates connect basic and intermediate events to top events.
Transfer or continuation symbol is a small triangle and is used to connect one part of a tree to another.
We will expand on the use of these symbols after introducing Event Tree Analysis.
10.4. Event Tree Analysis (ETA)
Event Tree Analysis is used to portray an accident as a sequence of events. It shows various systems or operator actions that can succeed or fail with resulting consequences. An ETA is very similar to a decision tree. They give many possible outcomes to a sequence of events.
ETA can be used to portray a sequence of events leading up to an accident. A spectrum of possible accidents and near misses can be developed. Also, it can be used to portray post-accident events.
It is often used in conjunction with FTA to perform quantitative risk assessments and in human reliability analysis.
10.5. “And / Or” Logic
“And/Or” Logic defines logic relationships between simple events that combine to cause other events. This simple “and/or” modeling can be used to describe complex situations. An example of “and/or” logic is the fire triangle shown on the next slide.
10.6. Fire Triangle
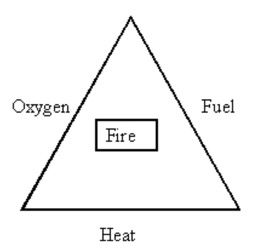
Three events must combine for a fire to occur. These three events are shown in the fire triangle. They are a supply of oxygen, fuel, and heat. To prevent or extinguish a fire, remove any one of these three criteria. To prevent a fire, do not have heat to provide an ignition source. To extinguish a fire, remove heat using water, for example, cooling the fuel.
10.7. “And / Or” Logic
Output occurs if signal A and B occur or if signal A and C occur or if signal B and C occur.
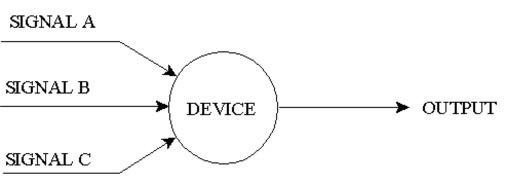
This diagram represents a device that processes input signals from three separate sources. An internal logic in the device produces an output signal. The device will only produce an output signal if two of the three inputs are present.
The And/Or logic can model this system by simply using logic operators: “and” and “or”. For instance, knowing that this device sends an output if only two of the three signals enter the device, we can say that output occurs if signal A and B occur OR if signal A and C occur OR if signal B and C occur.
10.8. Success Versus Failure Logic
Defining success is critical to developing a system failure logic. In other words, in order to determine how a system can fail, we must define what a system needs to succeed. An example is given on the next slide.
10.9. Success Versus Failure Logic(contd.)Seediagram in 10.7 above
Output occurs if: Signal A and Signal B occur
or Signal A and Signal C occur
Assume this is system success. The system failure logic is:
Output does not occur Signal A or Signal B do not occur
and Signal B or Signal C do not occur
and Signal A or Signal C do not occurChange all of the ANDs to ORs.
Change all of the original ORs to ANDs.
Change the basic event failures to basic event successes.
In this example in this slide, we define success as: an output signal occurs, with an input of two of the three signals into our device. The success logic can be transformed into failure logic as shown on the slide.
10.10. Success Versus Failure Logic(contd.)
Boolean algebra is the basis for Fault Tree Analysis
Sources used to identify success criteria
Boolean algebra is the mathematical basis for fault tree analysis. Defining success is critical to developing the system failure logic. The slide gives a partial list of sources of information used to help identify success criteria for a plant.
10.11. Fault Tree
Graphical Symbols combined for Logic Modeling
Symbols grouped into 3 categories:
Some fault tree symbols were shown on a previous slide. For more complex systems, it is easier to describe the logic graphically in a fault tree diagram.
This fault tree uses graphical symbols which are grouped into three different categories: events, logic gates, and transfer symbols. Additional symbols used in fault tree construction are shown on the next slide.
10.12. Symbols Used in FTA
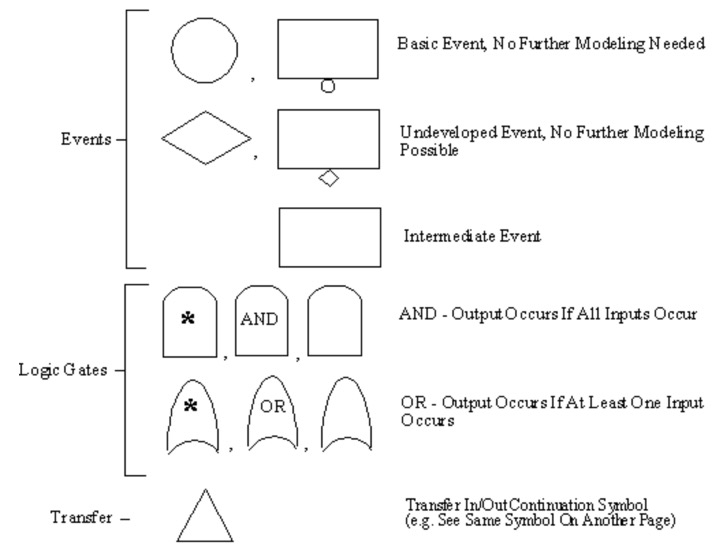
This slide gives examples of some of the symbology used in constructing a fault tree. There is a top event and intermediate events shown as rectangles. Primary or basic events describe initial faults. Undeveloped events are treated as basic events, but they are actually intermediate events. These events are assigned failure probabilities when system failure rate is quantified.
Logical gates are symbols used to represent AND and OR logic operators. These logic gates connect two or more inputs and provide a single output.
The transfer or continuation symbols a small triangle. It is used to connect one part of a tree to another part.
The next two slides will illustrate a fault tree for an electrical circuit.
10.13. Electrical Circuit
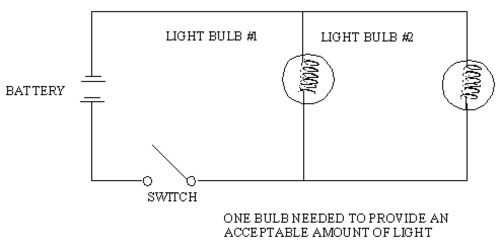
This slide shows an electrical circuit with one battery and two light bulbs in parallel. Light from a single bulb is sufficient for the system’s success.
Using this information, a fault tree diagram can be developed. This diagram is shown on the next slide.
10.14. Fault Tree
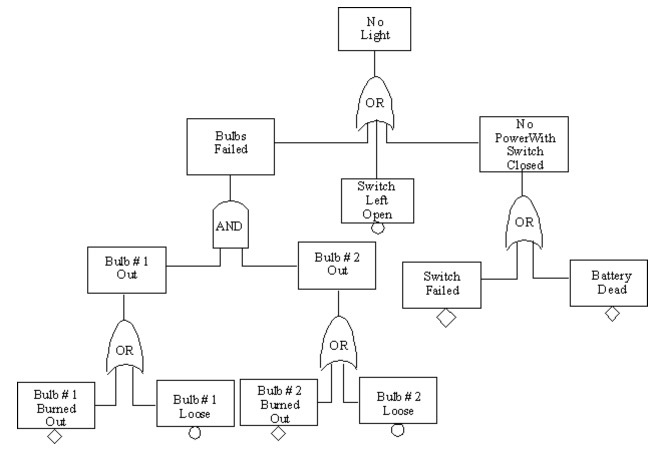
In constructing the fault tree, first the general system failure modes are defined.
For instance: no power, and light bulb problems even if power is available. Then you must match mechanisms with these failure modes. For instance: switch failure, dead battery, burned out bulbs, loose bulbs, or an unclosed switch. The first event at the top of the tree indicates no light. The next level of events is connected to this top event by an OR gate.
This OR gate gives 3 possible scenarios. The switch left open scenario indicates there is no power. This switch left open scenario along with bulb loose are considered basic events because no further breakdown of these events is possible. Therefore, they are shown with the small ball below the rectangle.
Battery dead, bulb burned out and switch failed are considered undeveloped events and are, therefore, shown with small diamonds below their rectangles. This means that they could be broken down further into more possible causes, but development was stopped because there was no information on frequency of the different types of component failures.
10.15. Guidelines for Fault Tree Construction
Failure: Identifies the failure of a component to operate properly, or the failure of an operator to perform a certain task
Guidelines for fault tree construction require defining some basic terms and making some distinctions between words that tend to be used interchangeably. Failure is a specific term used to identify the failure of a component to operate properly or an operator to perform a certain task. An example is the premature closing of a valve by an operator. The valve did not fail, but this is still a fault because it could have serious consequences
10.16. Guidelines for Fault Tree Construction
Fault
All failures are faults…...not all faults consist of failures
A fault is a more general term than failure. It can include the proper operation of an item at an inopportune time. Also, it can include the failure of an item to operate properly such as the premature closing of a valve by an operator. All failures are faults but not all faults consist of failures.
10.17. Guidelines for Fault Tree Construction
Component Fault: primary, secondary, or command fault
Primary Fault: Occurs within a component’s design capabilities
A component fault can be a primary, secondary, or command fault. A primary fault is one that occurs within a components design capability. For example, a pressure vessel fails at 125 psig when it is rated for 150 psig.
10.18. Guidelines for Fault Tree Construction (continued)
Fault Category
Secondary Fault:
Failure of the same pressure vessel, but at a pressure in excess of its design pressure
Command Fault:
Relates to the proper operation of a component at the wrong place or time
An example of a secondary fault is the failure of a pressure vessel at a pressure in excess of its design pressure. A command fault is the proper operation of a component at the wrong place or time.
10.19. Guidelines for Fault Tree Construction (continued)
Failure Effect: The effect of a component failure on a system
Failure Mode: An aspect of a component failure
Failure Mechanism: Describes specific ways in which a given failure mode can occur
Failure effect, mode and mechanism describes the effect on the system, and the mode is an aspect of the component failure. The effect of the failure in the light circuit example is no power from the battery. The failure mode could be no electrolyte or broken negative terminal. The mechanism could be a cracked battery case or battery sustained mechanical impact.
10.20. Guidelines for Fault Tree Construction (continued)
Active Failure: Failure of dynamic component that must move or change its state to perform its function
Passive Failure: Failure of a component that is basically static (pipe, wire, or support beam)
Failures can be active or passive. An active failure is the failure of a dynamic component that must move. An example is the failure of a motor-operated valve to close when a signal is sent. A passive failure is one where a pipe, wire or support beam fails.
10.21. Guidelines for Fault Tree Construction (continued)
10.22. More Guidelines
The “No Miracles Rule”
If the proper functioning of a particular component can cause a fault further along a system, assume the component performs its function normally
No “Gate-to Gate Rule”
AND and OR gates should not be directly connected to other gates
These are two rules that are often used as guidelines when constructing a fault tree. They are the “no miracles rule” and the “no gate-to-gate rule”. The “no miracles” rule implies that if the proper functioning of a component can cause a fault later in the system, you should assume that the component functions normally. In other words, do not assume that failure of the component will prevent the fault from occurring. The “no gate-to-gate” implies that gates should only appear between rectangles. They should not be connected to other and/or gates.
10.23. More Guidelines (continued)
“Complete the Gate” Rule:
Develop the tree horizontally before you begin to develop the tree vertically
Additional rules:
Fault Tree Handbook, NUREG-0492, U. S. Nuclear Regulatory Commission, Washington, D. C. (Jan. 1981)
Another rule is the “Complete the Gate” Rule.” This rules states that you must develop the tree uniformly across a given level (horizontally) before starting in any detail down any one branch (vertically). There are many other rules used in constructing a fault tree. They may be found in the Fault Tree Handbook referenced here.
10.24. Boolean Algebra
Very useful in FTA
Mathematics based primarily on variables that can have one of two values:
true/false
succeed/fail
on/off
happens/does not happen
1/0
The fault tree analysis manipulates the resulting Boolean algebra equation to find all the combinations of equipment failure so that you can arrive at the top event. Boolean algebra is mathematics based primarily on variables that can have one of two values: Some examples are provided here as true/false, on/off, 1/0, succeed/fail and the event happens/ or it does not happen.
10.25. Boolean Algebra Representation of a Fault Tree
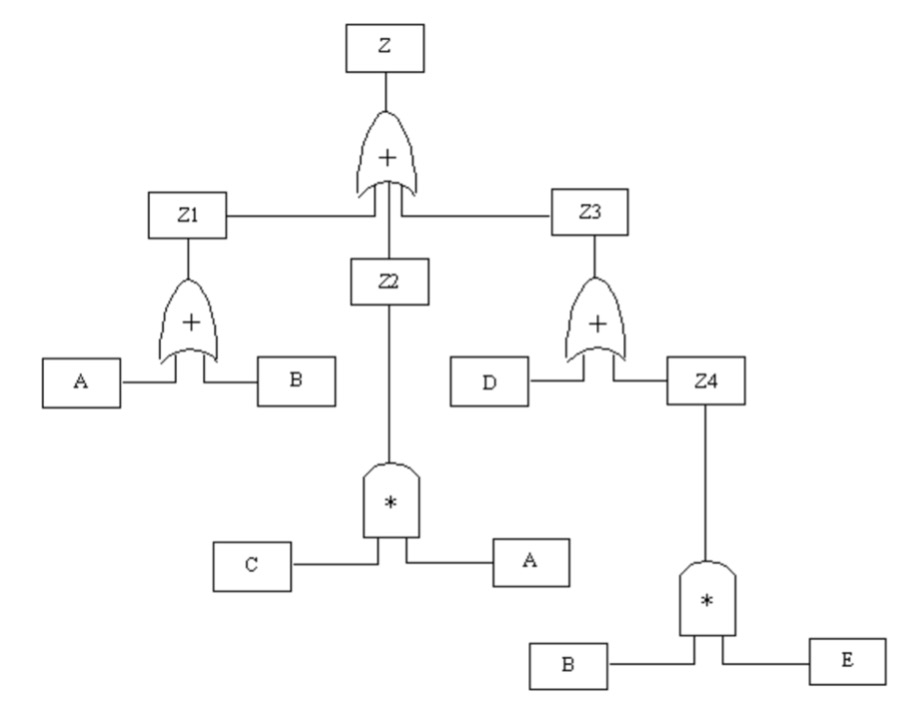
Boolean Equation:
Z=Z1+Z2+Z3
=(A+B) + (C*A) + D + (B*E)
=A+B+CA+D+BE
This diagram gives a fault tree and the Boolean equations that represent this diagram. The equation begins at the first horizontal level where Z=Z1+Z2+Z3. Also, we know that Z1 =A+ B, Z2 = C *A and Z3 = D + Z4 We further expand the equation so that Z4 = B * E. Therefore, the entire fault tree can be represented as a single Boolean equation, Z = A + B + CA + D + BE.
10.26. Boolean Review
Samples of Rearrangement Laws:
A * B = B * A
A + B = B + A
A * (B * C) = (A * B) * C
A + (B + C) = (A + B) + C
A * (B + C) = (A * B) + (A * C)
A + (B * C) = (A + B) * (A + C)
(A + B) * (C + D) = (A * C) + (A * D) + (B * C) + (B * D) = AC + AD + BC + BD
Examples of the Cancellation/Absorption Laws:
A * A =A
A + A = A
A + (A*B) = A
A * (A + B) =A
This slide summarizes some of the mathematical rules for binary variables. It is important to have an appreciation for these rules when you use computer codes that do these evaluations for complex fault trees.
10.27. Boolean Review(contd.)
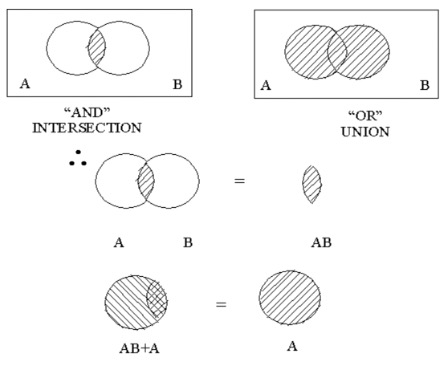
This diagram illustrates the adsorption laws of Boolean algebra.
10.28. Fault Tree Reduction and Equivalence
Reduction: The application of Boolean algebra to the fault tree to reduce it to a list of minimal cut sets
Equivalence: Two trees are equivalent if the reduction process produces the same minimal cut sets
Reduction and equivalence are two concepts that are important to fault tree analysis. Reduction is the application of Boolean algebra to the fault tree to reduce it to a list of minimal cut sets. The cut sets are the list of combinations of equipment failures.
Equivalence is when two fault trees that appear different are equivalent, if the reduction process produces the same minimal cut sets. An example is shown on the next slide.
10.29. Fault Tree Equivalence
To illustrate the concept of equivalence, we have shown here two fault trees that look very different from each other. As long as the basic logic is correctly coded into the structure of the trees, they can be equivalent in information, content, and results. They are equivalent if the reduction process produces the same minimal cut sets. Equivalence is an important property since in practice no two engineers will draw identical fault trees for the same equipment.
10.30. Common Cause Failures
Single events that can fail multiple components
Some common cause failure categories:
Shared Equipment
Control Circuits
Pneumatic Supplies
Common Location
Common Manufacturers
Common Maintenance Crew
Electrical Power
Cooling Water
Operators
Good engineering practice is to design redundancy and diversity into critical plant systems to improve reliability and reduce failure rates. Even the best design can be foiled by common cause failures. The concept of a common cause failure is that a single event has the potential to cause multiple components to fail. Some of the categories for common causes are listed here. They include shared equipment, electrical power, control circuits, cooling water, pneumatic supplies, operators, and the others listed.
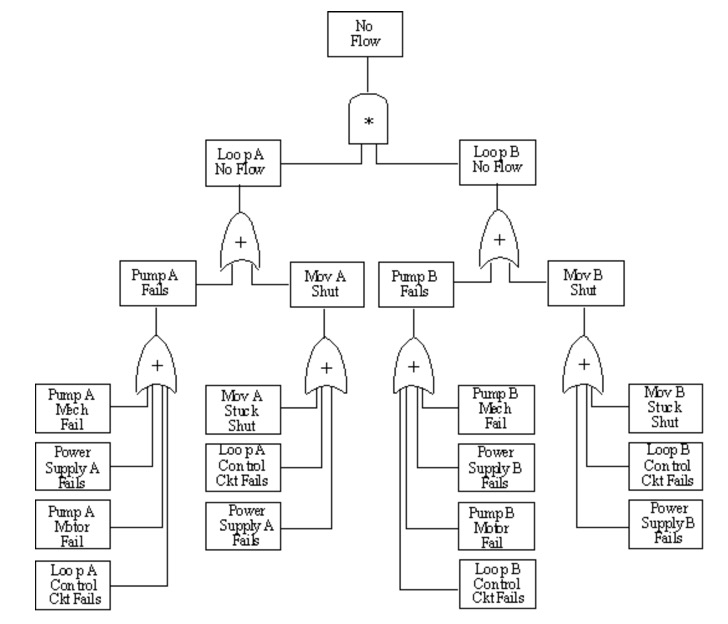
10.31. Common Cause Failures (continued)
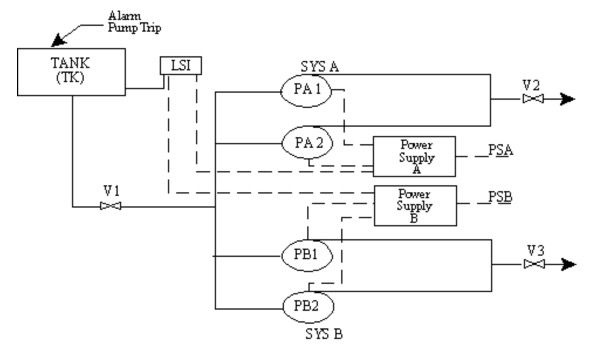
Support System (Controls) :
The process flow diagram for this diagram is a tank with a fill line and three exit lines going to different parts of the plant. In this example there are two redundant pumps and two redundant power supplies to be analyzed. The two redundant power supplies and two redundant pumps can be foiled by a single level switch failure. When constructing a fault tree for a system like this one, care must be taken to show the common reliance on a single level switch for the control signal to the pumps.
This support systems example shows how shared components and various support systems can be arranged so that they are susceptible to common cause failures.
There are three basic steps that should be followed in order to ensure that all potential common cause failures are identified. These steps are shown on the next slide
10.32. Steps to Identify Common Cause Failures
These steps include devising a coding system for components (loops) to ensure consistent basic event labeling. Ensure modeling within a system is carried out to a level where all the support system common points will show up. Use transfers to continue modeling of the support systems or shared equipment when model will consist of more than one basic event failure. The detailed fault tree for this example is given by Greenberg and Cramer, p. 154-5, and the two diagrams are too large and detailed to be shown here.
10.33. Fault Tree Analysis for a Reactor
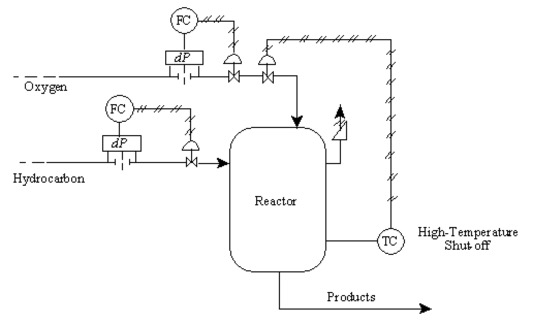
Symbols on the sketch include:
dP: pressure difference measurement device, used to measure flowrate
FC: Flow rate controller
TC: temperature controller
RV: relief value
AOFC: "air open-fail close": indication that a valve requires positive controller pressure to open and will automatically close should the instrument air supply close
Using the process flow diagram on this slide, construct a fault tree diagram for the top event “reactor ruptures” for the chemical reactor and its controls. A pressure difference measurement device, dP, is used to measure the flow rate. There is a flow rate controller, FC, and a temperature controller, TC. The relief valve is RV, and AOFC on the oxygen line is “air open-fail close”. Additional information for the problem is given on the following slide.
10.34. Fault Tree Analysis for a Reactor(contd.)
Partial oxygenation of a hydrocarbon is conducted in this reactor. It is exothermic, and operating conditions are moderately high temperature and pressure. The oxygen: hydrocarbon ratio must be maintained in a narrow range for proper operation. A runaway reaction can occur if the oxygen concentration increases into the combustion range of the hydrocarbon.
10.35. Fault Tree Analysis for a Reactor(contd.)
1. Determine the possible causes for a reactor rupture.
Both internal and external events could cause reactor failure. Failure could occur under normal operating conditions or under runaway conditions.
2. Develop the causes for the runaway reaction branch of the tree.
Even if a runaway starts, several simultaneous events would be necessary for the reactor to rupture.
3. Continue until "basic events" are reached.
Basic events are conditions such as failure of an instrument or valve.
Note that there is not one unique fault tree structure that could be used to analyze this reactor.
Use the information to develop the fault tree for the reactor. At the top a reactor rupture could be caused by a runaway reaction, a metal failure, or an external puncture.
For a runaway reaction there could be a high oxygen to hydrocarbon ratio, a failure of the high temperature interlock and the relief valve fails closed. The high temperature interlock failure could be related to the oxygen valve failing open and the interlock control failing.
A high oxygen rate could be related to the oxygen valve failing open which could be caused by a low flow signal or a control system failure.
A fault tree diagram is shown on the next slide which incorporates this information. Compare your diagram with this diagram.
10.36. Fault Tree for Rupture of Reactor

This is one form of the fault tree that can be used for the analysis of the “rupture of a reactor” scenario. Other equally valid constructions could be formed.
10.37. Event Trees
Modeling Multiple Systems or Sequences of Events
Many times, you need to model more than a single plant system to evaluate a particular hazard. In large plants more than one system is designed to an event involving a hazardous material. Event trees are needed when there are several systems playing a role in the response to an initiating event, and they model multiple systems of an event or sequences of events. They account for the interaction of multiple systems or multiple events. Therefore, they can prevent some upset or other initiating event that could lead to some hazardous outcome.
10.38. Typical Event Tree
This is an example of a typical event tree. It assumes the release of an explosive gas as an initiating event, and then it considers detection systems, immediate or delayed ignition and fire protection equipment operation. This determines the spectrum of possible consequences including flash fire, unconfined vapor cloud explosion, boiling-liquid expanding-vapor explosion or safe dispersal.
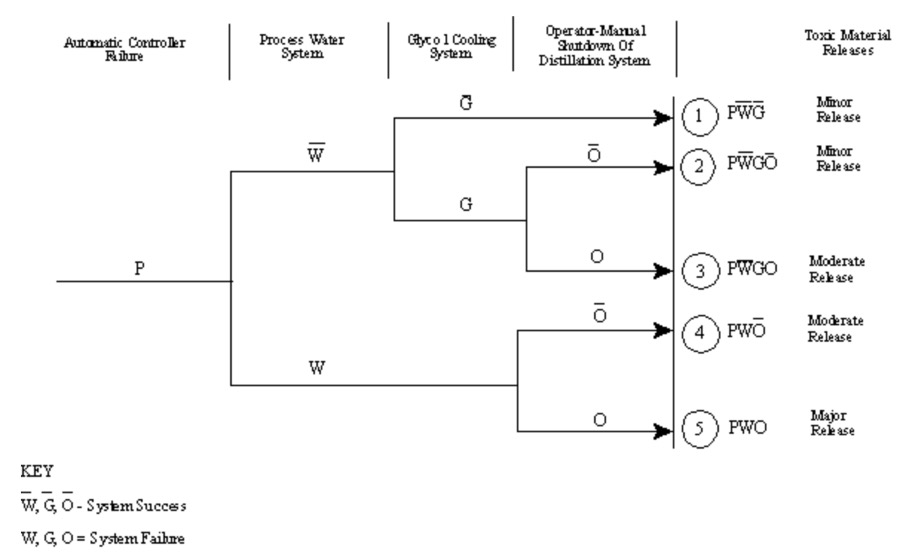
Here the failure is an automatic process controller. There are three subsequent events that can affect the outcome of the initiating event: a process water system, a glycol cooling system, and an operator who can manually shut down the system.
In this example, two sequences lead to a minor release and one sequence leads to a major release. At every step in the sequence, the various systems can either succeed or fail.
Notice that each branch of the event tree is identified with a symbol indicating that the event either succeeded or failed. W, G,O with bars on top indicate system success, and W,G,O without the bars indicate system failure.
The next step after constructing the event tree is to construct a combined system fault tree.
10.39. Multiple System Modeling
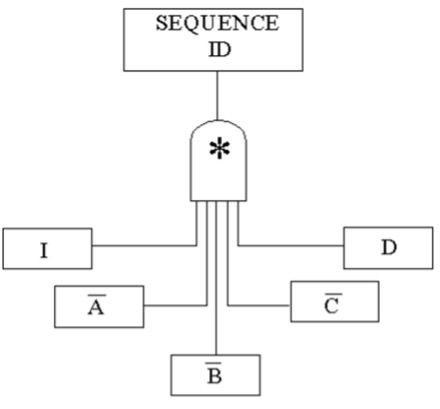
Each branch of an event tree has an identifying sequence of symbols as shown here as the sequence ID. They give the list of all the events that either succeeded or failed to get to the end of the branch. For each sequence a combined fault tree is constructed.
To analyze each sequence a fault tree is constructed for each system across the top of the event tree. Then link the fault/success trees to build a master fault tree that describes each sequence.
This is an example of multiple system modeling. This system is constructed for each sequence of system or event successes and failures. This tree allows us to analyze each sequence of concern
10.40. Linked Fault and Success Trees
When a fault tree is developed for a particular system, and the event sequence includes success of that system, we must change the fault tree into a success tree
When the event sequence includes success of a system and a fault tree is developed for this system, we must change the fault tree into a success tree. In doing this, we are able to detect any logical conflicts relating to a component or support system. To make this conversion, you change all of the “and” gates to “or gates, all of the “or’ gates to “and “gates, and all of the failures to successes.
10.41. Quantitative Analysis
Rules:
Fault Tree Analysis is a systematic examination of system failure logic and the construction of fault trees. It includes the Boolean algebra equations to find all the combinations of equipment failures that can lead you to the top event. This list of combinations of equipment failures is the cut sets.
These are the rules of fault tree quantification. Fault trees are not quantified. Minimal cut sets are quantified only after the fault tree equation is reduced to its minimal form. Further details and examples are provided by Greenberg and Cramer, p. 162-3.
10.42. Quantitative Analysis(contd.)
Quantitative results have their greatest value in comparing different options for risk reduction. They provide a basis for doing benefit–cost analyses and can guide decisions for capital expenditures.
10.43. Available Computer Programs
Computer programs are available to automate all of the tasks listed on this slide. These programs are from commercial vendors, and a web search will locate them. The Department of Energy’s National Laboratories, Sandia and Argonne, have developed codes and they are also available. In addition, the texts listed previously on risk assessment have reviews of codes and their capabilities.
10.44. Fault and Event Tree Analysis
Applications
Fault and event tree analyses are relatively complex tools to apply and can consume a significant amount of engineering man-hours by an experienced analyst. Also, the previously described techniques, for example HAZOP, have to be used to identify potential hazards. Fault tree analysis is applied only to the most critical hazards identified at a plant, after other analyses have been used to identify all of the potential hazards. Event Tree Analysis is used for systems in which an undesired event is suspected of being caused by more than one pathway.
10.45. Fault and Event Tree Analysis (continued)
Applications
Fault tree analysis is used when an undesired event can be stopped by more than one system or function. Also, it is applicable when strong system interaction exists or when the frequency of the undesired event is needed.
10.46. Fault Tree Analysis is Not Applicable…
Fault Tree Analysis is not applicable for the cases shown on this slide. This includes when undesired events can be caused only by external events or when undesired events cannot be stopped, slowed, or mitigated by a designed feature of the process. Also, it is not applicable when the system or function being considered is not supported.
10.47. Evaluation of the probability of the top event occurring for a fault tree
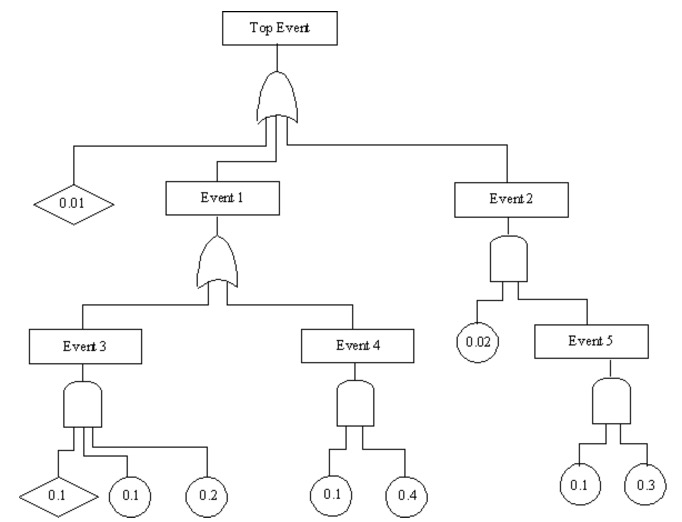
Evaluate the overall event probability for the fault tree shown on this slide. The numbers inside the circles and diamonds are the probabilities of basic and underdeveloped events.
Starting at the bottom, calculate the probabilities of each event by using appropriate probability formulas for the gates. Then, move up through each event to the top event. The next slide gives the equations to be used.
10.48. Evaluating Overall Event Probability for Fault Tree Analysis
Probability if n branches lead to the event through an AND gate
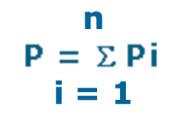
Probability if m branches lead to the event through an OR gate
through_or_gate.jpg)
Knowing the probability of occurrence of the branches of a fault tree, the probability of that event can be calculated. If the branches lead to the event through n AND gates, then the probability is given by the first equation on the slide, the product of the individual probabilities. If the branches lead to the event through m OR gates, the event probability is given by the second equation.
The procedure is to start at the bottom of the fault tree and calculate the probabilities of each event. Use the formula that applies to that gate. Then move up through each event to the top event. The probability of the top event depends both on the basic events and on the logical structure of the tree.
Apply this procedure and evaluate the probability of the top event shown on the previous diagram. Compare your result to the solution shown on the next slide.
10.49. Evaluation of the probability of the top event occurring for a fault tree
Starting at the bottom, calculate the probabilities of each event.
P5 = (0.1) (0.3) = 0.03
P4 = (0.1) (0.4) = 0.04
P3 = (0.1) (0.1) (0.2) = 0.002
Move up through each event to the top event.
P2 = (0.02) (P5) = (0.02) (0.03) = 0.0006
P1 = 1 - (1 - P5) (1 - P4) = 1 - (0.998) (0.96) = 0.04192
Pte = 1 - (1 - 0.01) (1 - P1)(1-P2)
Pte = 1 - (0.99) (0.95808) (0.9994) = 0.05207 top event
The calculations start at the bottom. Event 5 is an AND gate, and the product of probabilities is used. Events 3 and 4 are AND gates, also. Event 2 uses the results for event 5 (0.03) and 0.02 in the equation for an AND gate.
Event 1 uses the result from event 4 (0.04) and event 3 (0.002) in the equation for an OR gate.
The top event is evaluated using the result from event 2 (0.0006) event 1, ((0.04192) and 0.01 to evaluate the probability of the top event (0.05207).