Chapter 14. Quantified Risk Assessment
14.1. Quantified Risk Assessment
14.2. Communicating Results
14.3. Data Collection & Management
14.4. Data Collection & Management(contd.)
14.5. Data Collection & Management(contd.)
14.6. Qualitative Uncertainty Analysis
14.7. Qualitative Uncertainty Analysis(contd.)
14.8. Uncertainty Analysis Methods
14.9. Uncertainty Analysis Application
14.10. Relative Risks
14.11. Cause - Consequence Analysis
14.12. Cause - Consequence Analysis(contd.)
14.13. Cause - Consequence Analysis(contd.)
14.14. Cause - Consequence Analysis(contd.)
14.15. Cause - Consequence Analysis(contd.)
14.16. Cause - Consequence Analysis(contd.)
14.17. Cause - Consequence Analysis(contd.)
14.18. Risk Assessment Curve
14.19. Risk Assessment Curve(contd.)
14.1. Quantified Risk Assessment
Allows the analyst to compare results in relative terms and allows the analyst to rank them in order of their effect on the plant or public.
Quantified Risk Assessment is the combined use of the analytical tools to detect, prevent and mitigate risks associated with processing hazardous materials. These include HAZOP analysis, Event Tree Analysis, Explosion and Fire Analysis, Plume Dispersion Analysis and Health Effect Assessment. Quantified results allow the analyst to compare results in relative terms and sort and rank them in order of their effect on the plant and the public.
14.2. Communicating Results
- Provide a perspective of comparison with other known or acceptable risks
The overall objective of a risk assessment must be clearly communicated to others. In communicating the results, you must first state the overall objective of the risk assessment clearly. You may want to provide a perspective of comparison with other known or acceptable risks. Also, you must show the relative risk imposed by a particular process compared to other factors.
14.3. Data Collection & Management
Two types of data
Plant specific
- Equipment failure frequency
- Maintenance practices
Generic data from other sources
-Safety studies
To perform these analytical evaluations both plant and generic data are required. Assembling and organizing this data is a significant task in itself.
14.4. Data Collection & Management(contd.)
This slide provides a checklist for data collection. Data collection efforts should not consume time that should be spent on analysis. Usually, the type of analysis dictates the data requirements.
14.5. Data Collection & Management(contd.)
This checklist focuses on data for risk detection.
14.6. Qualitative Uncertainty Analysis
For parameter uncertainties and input data distributions
Qualitative uncertainty analysis is performed to estimate the effects of random errors on the data and parameters being used in the analyses.
14.7. Qualitative Uncertainty Analysis(contd.)
Uncertainty analysis is used to assess the degree of confidence in the results from a particular application. It estimates the effect of random errors in parameters and data and the effect of a lack of precision or completeness in the models.
4.8. Uncertainty Analysis Methods
Breach of a pressure boundary
Widely used techniques for uncertainty analysis are listed on this slide. These include classical statistical analysis methods and fault and event tree analyses.
14.9. Uncertainty Analysis Application
Now we will briefly discuss an example to illustrate the benefit of quantified risk assessment. The example is based on one type of risk analysis called cause-consequence diagrams. These diagrams start with an initiating or critical event which is chosen as a logical starting point for a series of possible event sequences.
A typical critical event might be a breach of a pressure boundary, an initiation of a batch reaction or startup procedure, a transient that activates a safety system or a phase-to-phase or phase-to-ground electrical short.
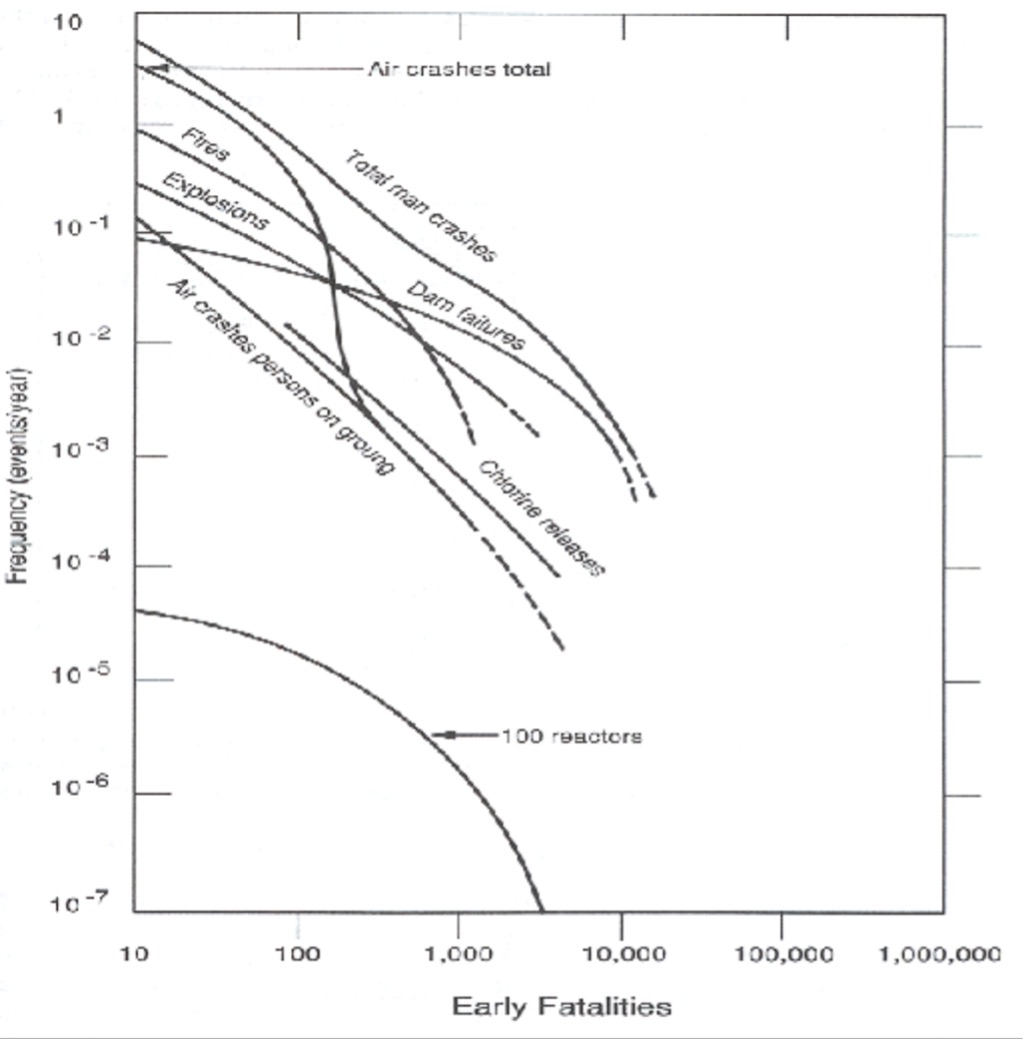
14.10. Relative Risks
This illustration shows the frequency of man-caused events involving fatalities. This shows that the relative risk imposed by 100 nuclear reactors is a small fraction of the risk imposed by the sum of the events in terms of early fatalities.
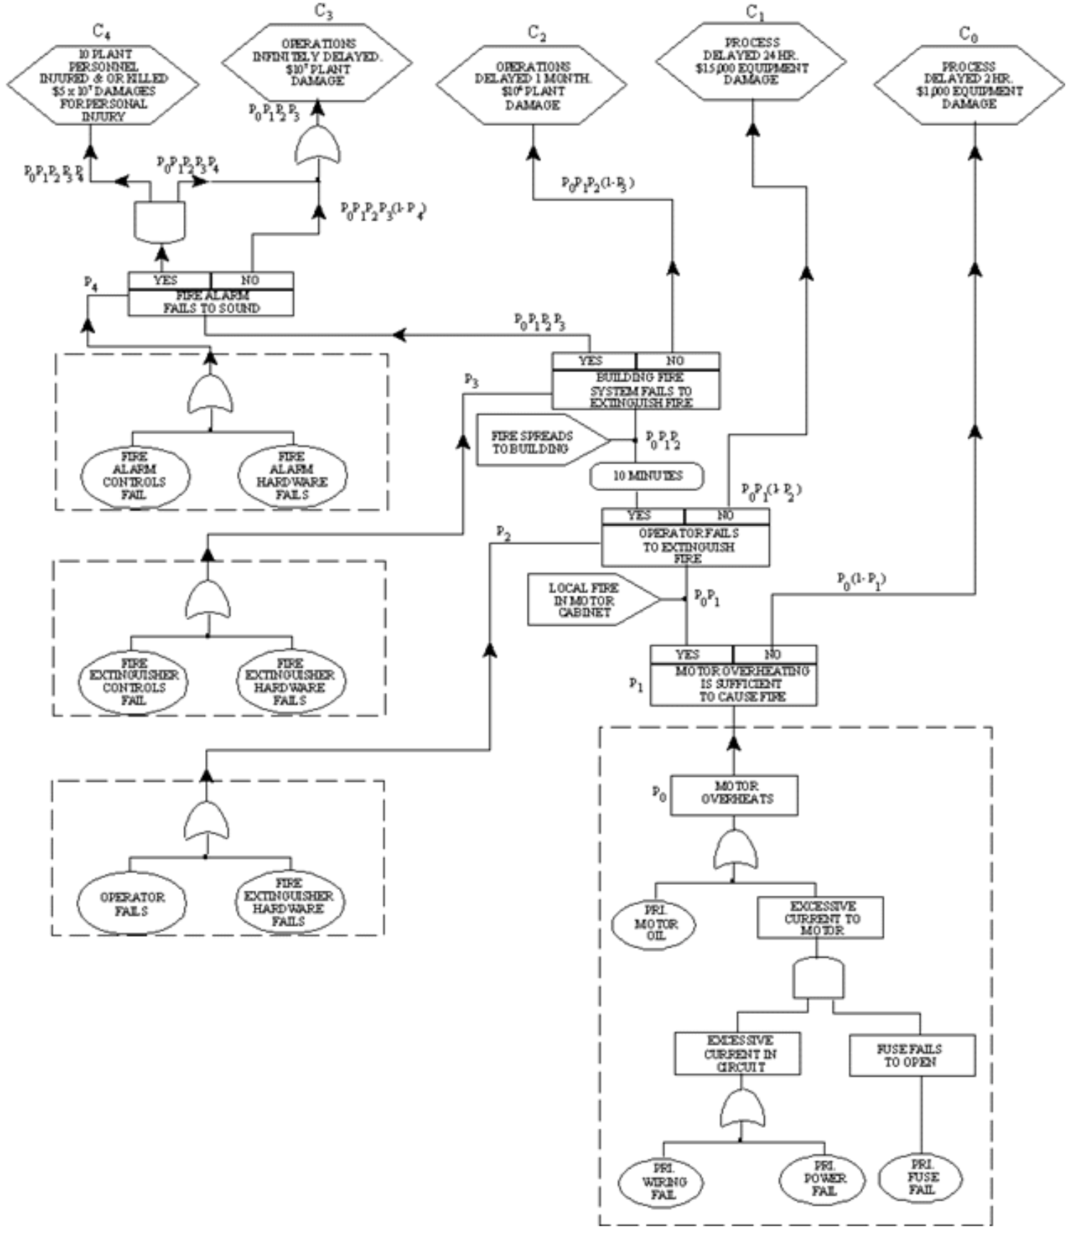
14.11. Cause - Consequence Analysis
For Cause-Consequence Analysis, you must first trace the sequence of events from the initial critical event through many possible conclusions, branching at each decision point toward success or failure. This is similar to a fault tree analysis.
A cause-consequence diagram is developed to apply simple estimates of probability and consequence to each event, and a risk assessment curve is constructed.
14.12. Cause - Consequence Analysis(contd.)
Probability Estimates for Cause-Consequence Diagram
Motor overheats (lower right-hand corner) fault tree for initiating event.
Probability Po =0.088
Fire results Probability P1 = 0.02
Operator fails to extinguish fire P2 = 0.133
Fire extinguisher failure P3 = 10-5
Fire alarm control failure P4 = 5x10⁻⁵
Fire alarm hardware failure rate = 10-5
14.13. Cause - Consequence Analysis(contd.)
In this part of the Cause-Consequence Analysis downtime losses is estimated as $1000 per hour for a two hour delay plus $1,000 for damaged equipment.
14.14. Cause - Consequence Analysis(contd.)
C0 [risk] = $3,000 *0.086 = $258
This slide shows evaluating the probability for this event sequence and determining the risk expressed in dollars.
14.15. Cause - Consequence Analysis(contd.)
In this part of the Cause-Consequence Analysis lost production is estimated as $24,000 plus $15,000 for damaged equipment.
14.16. Cause - Consequence Analysis(contd.)
C1 [risk] = $39,000 * 1.53x10-3 = $60
This slide shows evaluating the probability for this event sequence and determining the risk expressed in dollars.
14.17. Cause - Consequence Analysis(contd.)
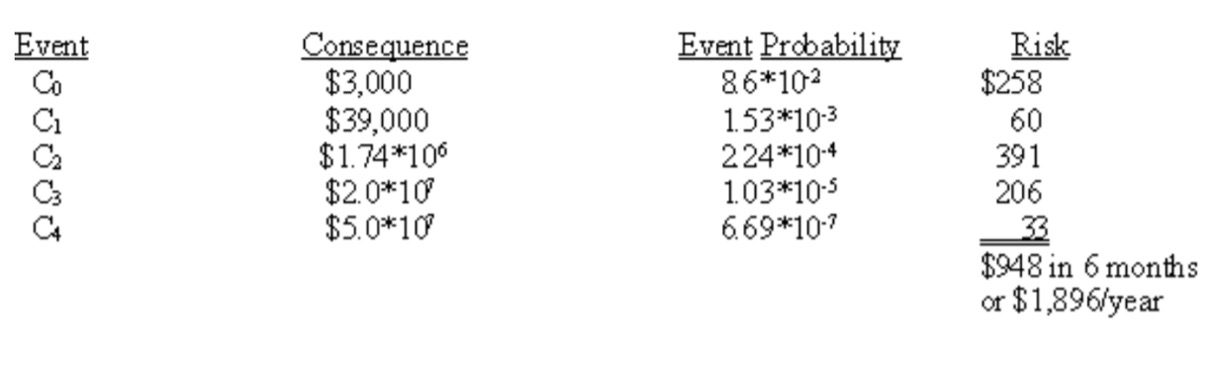
In this table the consequences and event probabilities are summarized for the Cause–Consequence diagram. The information developed for the other parts of the diagram were developed as illustrated on the previous slides. This table shows that about 40% of the risk stems from potential failure at the hand extinguisher level and that the total risk from the motor over heating event is about $1,900 per year.
14.18. Risk Assessment Curve

A Risk Assessment Curve can be constructed from the information given in the table developed from the cause-consequence diagram. The curve has the properties that it should show a constant risk line where events to left of line are acceptable, and events to the right are unacceptable. This curve can be seen on the next slide.
14.19. Risk Assessment Curve(contd.)
This is the Risk Assessment Curve. This curve was constructed from information given by the risk calculation table. The risk from event C3 in the previous table is from the failure of the operator to use the fire extinguisher (event probability 1.03x10⁻⁵, consequence $2.0x10⁷) and justifies firefighting training. The dashed line shows a constant risk line of $300. This curve implies that the events to the left of the line are acceptable. The events to the right of the curve are unacceptable, or they are at least candidates for further analysis.